We've had our solar panels for exactly a year. Our roof has an East/West aspect - and we have 2.5kW of panels on each side.
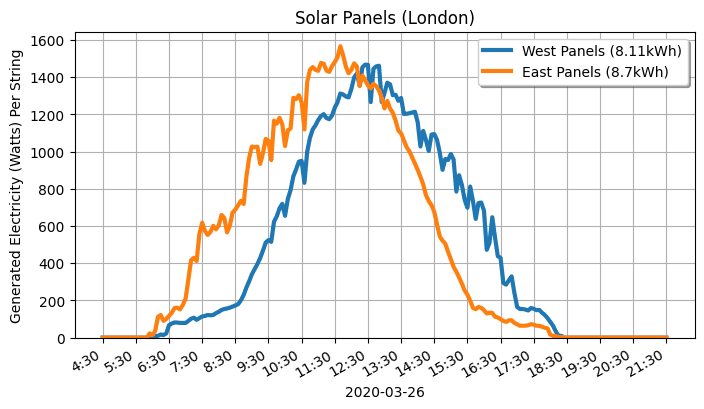
Here's a typical graph showing how each side performs during the day.
 @Edent_Solar
 Automated

East facing solar panels 🆚 West facing solar panels. London, UK.
pic.x.com/JBcd5KPGyJ


What I find interesting is that the side facing away from the sun is much less affected by cloud cover than the side facing the sun. In this example the Easterly panels generation is wildly variable up until midday when the sun passes over the top of the house. At which point, all the light they receive is indirect.
@Edent_Solar
Automated
East facing solar panels 🆚 West facing solar panels. London, UK.
pic.x.com/i1pS2UrvhP


So, over the full year, which side produces the most free-range, organic, small-batch electricity for us?
I had a year's worth of CSV files - luckily Pandas makes it pretty easy to concatenate them all and then do mathemagics:
Python 3
### Getimport os import glob import pandas as pd extension = 'csv' all_filenames = [i for i in glob.glob('*-strings.{}'.format(extension))] combined_csv = pd.concat([pd.read_csv(f) for f in all_filenames ]) combined_csv.columns = ["Time", "East", "West"] total = len(combined_csv) (combined_csv["East"].sum() / total) * 6 (combined_csv["West"].sum() / total) * 6 today's data from the inverter ```python today = now.strftime("%Y-%m-%d") # Get today's data from the inverter API_url = "http://" + fronius_IP_address + "/solar_api/v1/GetArchiveData.cgi?Scope=System&StartDate=" + today + "&EndDate=" + today + "&Channel=Voltage_DC_String_1&Channel=Current_DC_String_1&Channel=Voltage_DC_String_2&Channel=Current_DC_String_2" response = requests.get(url=API_url) data = json.loads(response.text)
Add it into a structured and ordered format
string1_current = data["Body"]["Data"]["inverter/1"]["Data"]["Current_DC_String_1"]["Values"] # Keys to ints, Values to floats string1_current = {int(k):float(v) for k,v in string1_current.items()} string1_current = sorted(string1_current.items()) string2_current = data["Body"]["Data"]["inverter/1"]["Data"]["Current_DC_String_2"]["Values"] # Keys to ints, Values to floats string2_current = {int(k):float(v) for k,v in string2_current.items()} string2_current = sorted(string2_current.items()) string1_voltage = data["Body"]["Data"]["inverter/1"]["Data"]["Voltage_DC_String_1"]["Values"] # Keys to ints, Values to floats string1_voltage = {int(k):float(v) for k,v in string1_voltage.items()} string1_voltage = sorted(string1_voltage.items()) string2_voltage = data["Body"]["Data"]["inverter/1"]["Data"]["Voltage_DC_String_2"]["Values"] # Keys to ints, Values to floats string2_voltage = {int(k):float(v) for k,v in string2_voltage.items()} string2_voltage = sorted(string2_voltage.items())
Calculating the power
timestamp_list = [] string1_watts = [] string2_watts = [] for current, voltage in zip(string1_current, string1_voltage): timestamp_list.append(str(datetime.timedelta(seconds=current[0]))[:-3]) # Remove the seconds string1_watts.append(int(current[1] * voltage[1])) for current, voltage in zip(string2_current, string2_voltage): string2_watts.append(int(current[1] * voltage[1])) # Remove the first 4:30 hours (54 * 5 minutes) # Earliest sunrise about 04:40 # Latest sunset about 2130 timestamp_list = timestamp_list[54:] string1_watts = string1_watts[54:] string2_watts = string2_watts[54:] # Total Power Generation # Bit sketchy. Only samples ever 5 minutes. string1_kWh = str(round(sum(string1_watts) * 5 / 60 / 1000, 2)) string2_kWh = str(round(sum(string2_watts) * 5 / 60 / 1000, 2))
Write the CSV
This is my least favourite part of the code. It zips together the timestamps and the wattage from the first String. Then zips it with the 2nd String.
with open(csv_file, 'w', newline='') as csvfile: writer = csv.writer(csvfile) for a, b in zip(zip(timestamp_list,string1_watts),string2_watts): t = str(a[0]) w1 = str(a[1]) w2 = str(b) writer.writerow([t,w1,w2])
Source Code
All available on my GitHub
Output
 ```
```
- East generated 2,130kWh.
- West generated 2,254kWh.
So West is roughly 5% better at generating electricity than East. But there isn't much in it. The data isn't completely clean - sometimes my monitoring software was down for a few hours. I'd put that 5% within the margin of error of the accuracy of my measuring system.
Basically, don't be put off if you can only have panels on one side of your roof.
14 thoughts on “Which generates more electricity - East- or West-facing solar panels?”
I figured I consumed a higher percentage of my own electricity from the west facing panels when I had them. Doesn’t matter if you have a battery of course.
| Reply to original comment on twitter.com
@Edent interesting! It would even more interesting also a south comparison. Change roof accordingly 😜
| Reply to original comment on libranet.de
JohnU
Must be a big roof to fit 250kW per side.
@edent
Not really. You can see some pictures on Relaunching @edent_solar. Part 1 – installation.
Mark Duncombe
Interesting stuff. Does having an East/West split compared to south only impact EV charging? Does it result in a smaller window where an EV can be charged?
@edent
I written a fair bit about solar charging an EV.
In short - don't worry too much about it. Electricity is fungible. There's no noticeable change in "window". But it rather depends when you park your car at home.
Good Analysis on the effective facing of solar panels. If your rooftop solar system is installed in an open area where solar energy is available in sufficient strength then it will generate the required amount of energy. Still, many researchers say south-directed solar panels produce more energy than the other direction.
@Edent Like JohnU, I'm impressed by 250 kW of panels each side. I assume you really mean 2.5 kW (8 × 320 W).
| Reply to original comment on octodon.social
@edent
Thanks! Corrected.
Sean Burlington
We have 16 panels facing south - 10 years old so only 3.2 Kwhp (technology has improved - the panels are still good)
Looking at your graphs compared to mine - you have a much longer peak - which is a good thing for consuming your own power.
When the feed-in-tarrif was high the main concern was to generate as much power as possible at any time of day - as this generated the return (you get paid for what you generate)
But with prices going up and the feed in tarrif going down this changes.
These days you just want as much of the day as possible where you don't draw power from the grid.
Like today - it as a sunny January and I got 7kwh
But a lot of that was getting 2kw around lunch time - a lot of which got exported,
If I could have had more power earlier from east facing panels and later from the west - I would have consumed less overall.
Richard Williams
Many interesting things on your graph showing the east/west split. I appreciate it's only a single day and therefore we don't know if it's a typical day or a fluke. For example, the east generation is erratic in the morning when the sun is on those panels, and perhaps is being affected by passing clouds, and smooth in the afternoon when the sun is a best glancing across the panels, or they are lit solely by sky. And the west panels show the same effect in reverse. Also, "noon" isn't exactly 12:00, and anyway as your roof isn't exactly at 90 degrees you don't expect complete symmetry. And on your time line axis possibly it's set itself to BST. Nevertheless, if you look at where the east and west generation lines cross, you could read that as noon being just a couple of minutes after 13:00.
@edent
You can view all of the graphs at https://botsin.space/@solar
Our house is also East/West, we’ve had ours since February and had 12 (430Wp) installed. I also expected the west to be the most effective and split them 4 east - 8 west. Year to date, the East panels have generated more power.
| Reply to original comment on bsky.app
East/west may produce slightly less power in the sum, but for self consumption the generation profile is better than just south.
| Reply to original comment on bsky.app
More comments on Mastodon.
What links here from around this blog?