Creating an "Organization of Cartographers for Social Equality" map with OpenStreetMap
If you've seen that episode of The West Wing, you'll remember this scene:
I'm not a paying member of the OCSE, but I fully support their aims. Because messing around with maps is fun. So, can I build a web-first maps which is South-up, Pacific-centred, and Peters-projected?
Here's what I managed to do using OpenLayers - an Open Source web maps library which is pretty hackable.
Get started
Following the example documentation gets us a boring North-up map. Booo!
Flip that, reverse it
Rotating a map about 180° is pretty easy:
JAVASCRIPT
view: new ol.View({
maxZoom: 19,
zoom: 3,
rotation: Math.PI
})
The rotation option is is radians - so you'll need to remember your GCSE maths in order to recall that Pi radians = 180°. There's a small but significant problem.  Everything is upside down. Including the text.
Vectorman
That's because the default tiles use raster images. We need vector images.
JAVASCRIPT
layers: [
new ol.layer.VectorTile({
source: new ol.source.VectorTile({
format: new ol.format.MVT(),
url: 'https://basemaps.arcgis.com/arcgis/rest/services/OpenStreetMap_v2/VectorTileServer/tile/{z}/{y}/{x}.pbf'
}),
})
],
 That looks a bit dull, so lets add some proper styles to it:
HTML
<script src="https://cdn.jsdelivr.net/npm/ol-mapbox-style@4.3.1/dist/olms.js"></script>
and
JavaScript
var layer = map.getLayers().getArray()[0];
var url = 'https://www.arcgis.com/sharing/rest/content/items/3e1a00aeae81496587988075fe529f71/resources/styles/root.json'
fetch(url).then(function(response) {
response.json().then(function(glStyle) {
olms.applyBackground(map, glStyle);
olms.applyStyle(layer, glStyle, 'esri');
});
});

This uses the OpenStreetMap vectors from Arcgis - but it can be changed to any other style you like.
Location, Location, Location
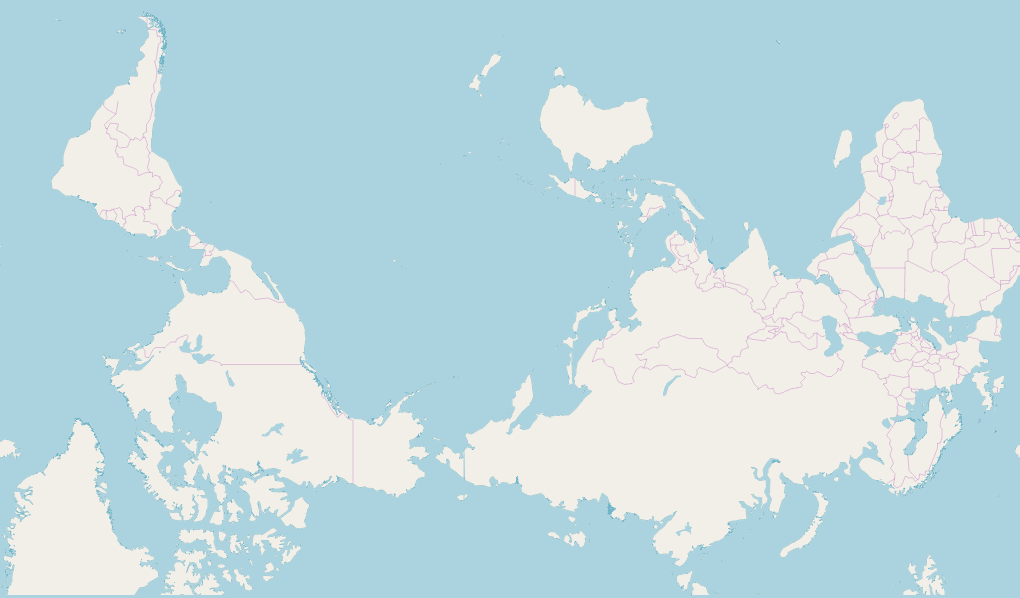
At the moment, the centre of the map is at 0° - with the UK in the centre. That's no good! We want Aotearoa - the land of the long white cloud, and ancestral home of my wife - to be in prime position.
JAVASCRIPT
view: new ol.View({
center: ol.proj.fromLonLat([180, 0]),
zoom: 3,
rotation: Math.PI
})

Success!
Projecting
Here's comes the tricky bit. At the moment, we are still using the Mercator Projection which distorts the size of some countries. I'm not going to get into an argument about which projection is best - but I want to show how to re-project an existing map.
With a raster map - where the tiles are bitmaps, not vectors - it's pretty easy. 
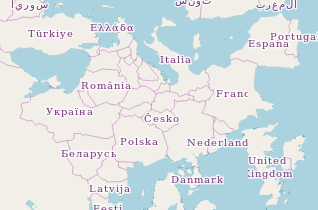
But when zoomed in, this gives us the worst of both worlds:  The place-names are upside-down and are distorted.
Reprojecting Vectors
I naïvely thought this would be easy. Manipulating vectors doesn't sound so hard, does it? But I just can't find any way to do it in OpenLayers. It doesn't work in any web mapping library I've found. And there are no Peters-projection raster tiles either.
I suspect the answer is that I would have to create my own tileset - which is beyond my capabilities.
So, if you know of a way to get a weird projection out of web maps - please let me know in the comments box.
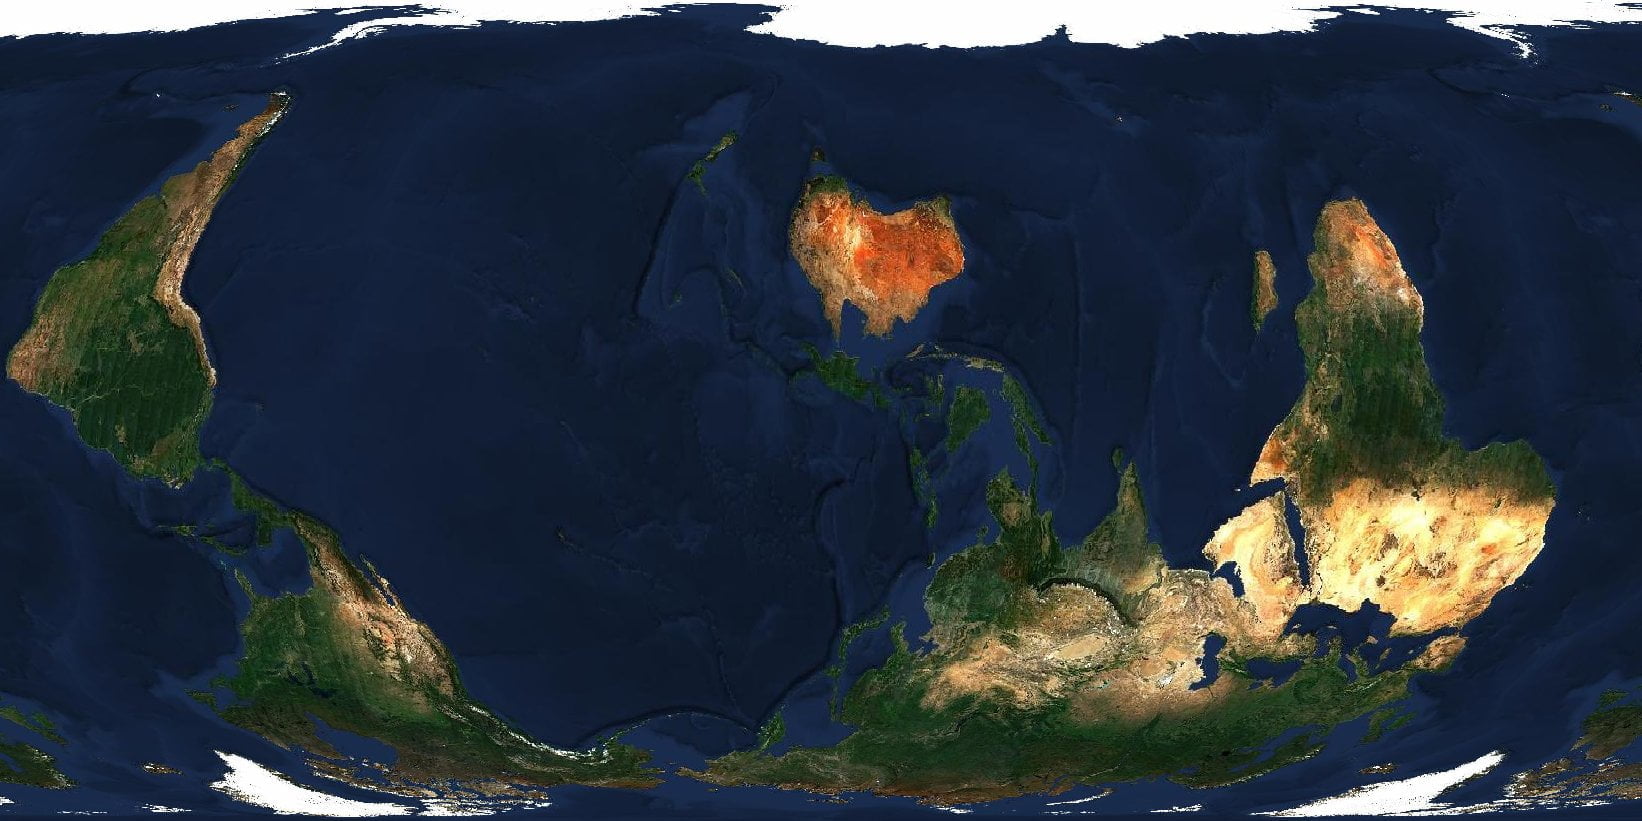
 South Up, NZ Centric, Equal Earth Map
 Reprojecting Satellite Maps
Sam says: