The Solar Solstice
By @edent![]() · solar · 2 comments · 500 words · read ~216 times.
· solar · 2 comments · 500 words · read ~216 times.
As regular readers know, we've installed solar panels on our house in Oxford.
The panels were originally installed on 17th December 2013 - that's pretty close to the winter solstice, where the UK experiences the lowest hours of sunlight.
Today is the summer solstice. Time for Druids to dance around Stonehenge as we celebrate the longest day of the year. And time for me to celebrate half a year of graphing my Solar Panels.
So, what are the results?

This year we've generated a whopping 2,013MWh. Yup, we're firmly in double-MegaWatt-hour territory.
To put that into perspective, the average UK household uses around 3.5MWh per year. By our reckoning, our place uses 3.1MWh per year. Either way, with half the year to go, we've already smashed through the 50% barrier and are well on our way to totally offsetting our electrical energy needs.
Let me state that clearly. A regular domestic 4kW solar installation can be enough to generate all the electricity a normal house uses.
Show Me The Money
The UK government pays all energy producers for generating electricity. We get a fixed amount per kWh generated, and a smaller amount for each kWh exported back to the grid. While it's slightly tricky to calculate, we should be paid £364.87 for the last 6 months.
Given that the system cost us £8,000 to install, we're on track to have it paid off in 11 years (8000/(365*2) = 10.95) purely from the feed-in tariff.
The payments rise by inflation each year, which I have not factored in.
We're also paying less on our electricity bills. Again, it's not an exact calculation, but we should be saving about £300 per year - or £150 solstice-to-solstice.
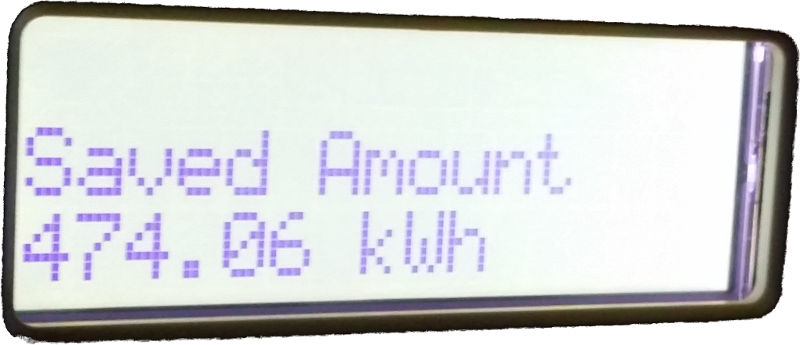
Gas is another saving. We use a Solar iBoost which diverts excess solar energy into our hot water system. According to the readout on the system, it has pumped 474kWh into our plumbing.
I'm not sure exactly how much that's going to save over the year. Using Ovo's "people like me" comparison tool, it's easy to see the impact it has on our gas use though.

Graphing Time!
I'm sure you all avidly follow @edent_solar on Twitter - so you get to see the daily charts it produces.
Beautiful day. @edent's solar panels generated ~24.13kWh, earning £4.27
FAQ: http://t.co/Z2qLtJCLxz#edentSolar pic.twitter.com/excDcGEdCa— Edent's Solar Panels (@Edent_Solar) June 10, 2014
If not, here are this year's vital statistics. There are one or two days missing - due to technical cock-up, not solar eclipse - but the data are fairly complete.

The blue columns are the daily totals (with a trend line) - on the left-hand Y-Axis.
The yellow area represents the cumulative total power generated - the right-hand Y-Axis.
So, there we have it - assuming the second half of the year holds up, our solar installation is perfectly sufficient to offset our needs.


What maintenance is required and how often? Will that be extra cost?
An excellent question. They are maintenance free - in the sense that the British weather is sufficient to wash off any dust / debris on them. If not - a water hose will do the job.
The parts are guaranteed for between 10-25 years - and backed with insurance. While it's unlikely that the panels will need replacing, the wiring and other sundries could need work. Luckily, they're getting cheaper all the time!