Humm Energy Monitor Set Up – Part 5 – Data Visualisation
After my disastrous attempt to upload data under Ubuntu, I found a Windows laptop to upload my energy usage data.
The good news is that Sam from Humm is actively working on making the Adobe Air upload application work under Linux. So, how does the process of uploading your data to the service work?
All in one
The Application is a real "one click" experience. It autodetects your SD card, sees which files are there, and sends them straight to the server after you click the button.
Here we go...
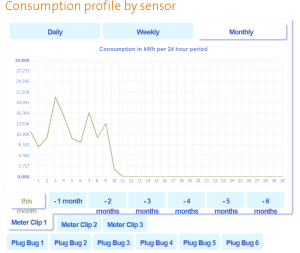
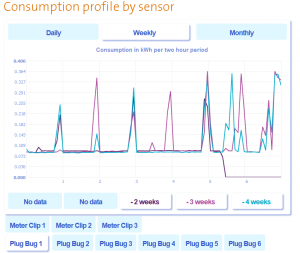
So, after waiting a few hours for the data to process - what do the graphs look like.
Well, they're a little underwhelming and a bit of a mess. Now, in fairness, I've only uploaded a few weeks' of data - no doubt the graphs will be richer when I've uploaded more data. This is a beta service and it's clear that there are a lot of improvements being made.
Annoyingly, you can't compare two different Plug Bugs - so I've no way of knowing if my computer is more energy efficient than my laptop.
There doesn't seem to be a way to go into historic data
There's no graph to show my gas usage. I've questioned the wisdom of a gas monitor - it only looks at hot water so doesn't measure cooking or hot air systems.
Overall, this is a pretty good start. I can see my hourly, weekly and monthly usage and compare how I'm doing. It could do with some spit and polish to make the graphs more intuitive and useful. I wonder if there's any way to get the data into Pachube or something similar.


6 thoughts on “Humm Energy Monitor Set Up – Part 5 – Data Visualisation”