
I am a regular user of Transport for London's services. On my phone I have the TfL Go app for finding my way around the city, and a web shortcut to a specific bus stop so I can find my way home. Why are they different shades of blue⁉️⁉️⁉️ TfL, like most large organisations, have brand guidelines. It enables them to set a consistent look and feel across their services which, hopefully, makes it…
Continue reading →
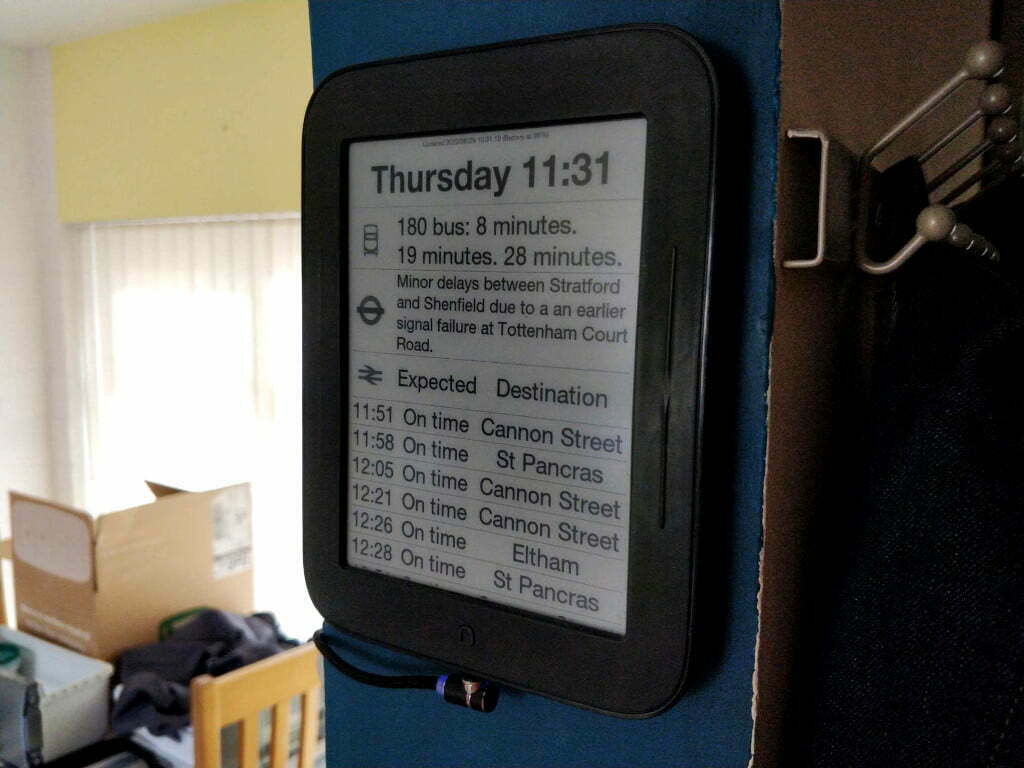
Last year, I blogged about how I turned an old eReader into an Information Screen. I've since updated the display to show me three different sets of transport information. At a glance, I can see the next bus, whether there are delays on the Elizabeth Line, and if my regular trains are running. Here's how all three APIs work. Bus The bus is the easiest one of all. Transport for London (TfL) …
Continue reading →

Force Directed Graphs of the London Underground have been done many times before - but I think I'm the first person to add the new Elizabeth Line (CrossRail). I've also created a JSON graph of all of London's rail services - including DLR, Trams, C2C, ThamesLink etc. Demo Play with it yourself Grab the code from GitLab I've also created a version with every London station and train line. …
Continue reading →
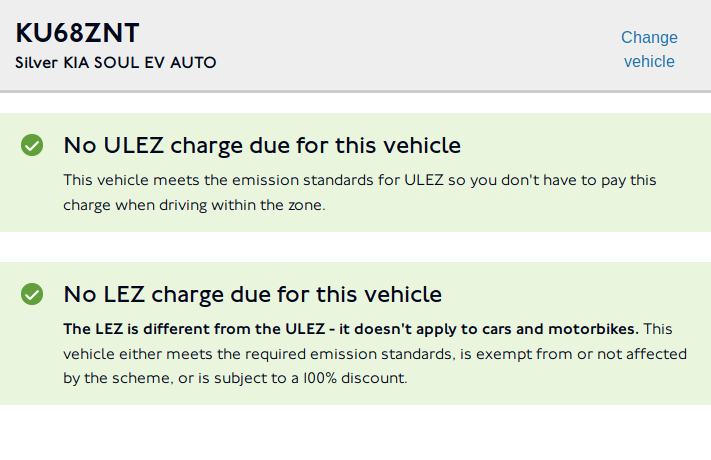
Another middle-class rant about an easily solved problem. Or, how a software bug nearly cost me £80. Things you should know... London has a Congestion Zone. You have to pay £11 to drive through it. If you have an EV (Electric Vehicle), you don't have to pay the Congestion Charge. Easy, right? Not quite. In order to get the 100% discount, you have to register your vehicle and pay a £10 per …
Continue reading →
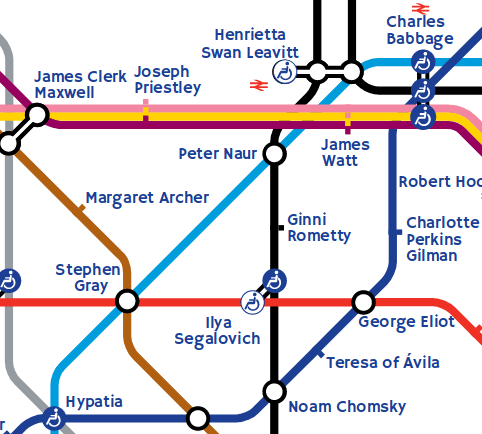
One of my favourite works of art is The Great Bear by Simon Patterson. At first glance, it appears to be a normal London Tube map. But look closer... Cool! But there is something about it which has always bothered me. Each Tube line represents a theme - therefore, a station at the intersection of multiple lines should be represented by someone who matches all of those themes. For example,…
Continue reading →

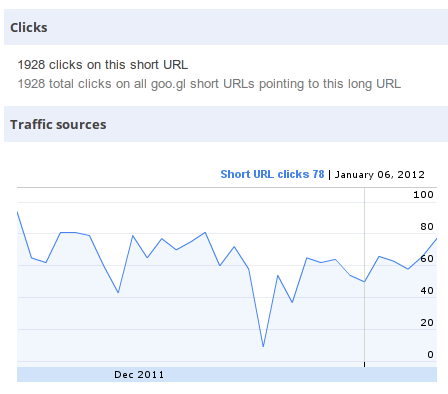
At the start of 2012, I revealed how many scans TfL's QR campaign was getting. A lot of comments on Twitter & Google+ dismissed these results as a success. A typical response was: 70 scans a day? In a city of millions? Rubbish! This fails to address something that advertisers are conspicuously loathe to reveal - the true "response rate" of any advert is hard to calculate. How many phone…
Continue reading →
Last year, I suggested that TfL should use QR codes to point to their excellent mobile countdown service. Looks like someone was listening! I spotted this poster at a tube station. Nestled in the corner is a QR code pointing at the mobile bus countdown service! This is a close-to-perfect use of QR. Points to a mobile site. Easy to scan code. Good call to action. As I…
Continue reading →

There are Nineteen thousand, five hundred bus stops in London! Each one of them is (eventually) going to be upgraded with a new real time bus countdown signs. If you've got an Internet capable phone, you can get real time information for your bus at http://m.countdown.tfl.gov.uk/. The service has a number of cool features, including geolocation. The great thing, in my opinion, is that each…
Continue reading →

I wander around the world in a perpetual state of confusion. Why is the world the way it is? Why do people make bad decisions? Why - when there are so many better alternatives - do people choose the worst of all possible worlds? Rather than getting bogged down in philosophy, I refer to the reason people choose Microsoft Windows to do anything public facing. Advertisers obviously care…
Continue reading →

Sousveillance (pronounced /suːˈveɪləns/, French pronunciation: [suvɛjɑ̃s]) as well as inverse surveillance are terms coined by Steve Mann to describe the recording of an activity from the perspective of a participant in the activity, typically by way of small portable or wearable recording devices that often stream continuous live video to the Internet. http://www.youtube.com/watch?v=u804C65q_Jk …
Continue reading →


