I read this brilliant blog post by Wouter Groeneveld looking at how many dead links there were on his blog. I thought I'd try something similar. What is a broken link? Every day, I look at the On This Day page of my blog and look at that day's historic posts. I click on every link to see if it is still working. If it isn't, I have a few options. If the site is working, but the content has…
Continue reading →

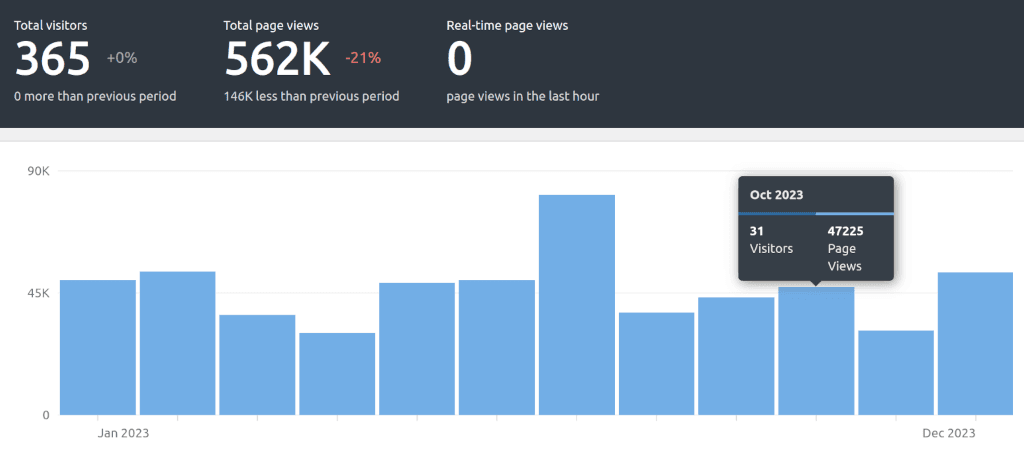
I've quit JetPack stats. I've moved to Koko Analytics. All the stats code is self hosted, it is privacy preserving, and the codebase is small and simple. But I am vain. I want all my old JetPack stats to appear in Koko so I can look back on the glory days of blogging. Koko has two main tables. The first is a summary table called wpbp_koko_analytics_site_stats : date visitors …
Continue reading →

It's sometimes useful to run experiments yourself, isn't it? New investors are often told that, when investing for the long term rather than chasing individual stocks, it is better to be invested for the longest possible time rather than trying to do "dollar cost averaging". DCA is the process of spreading out over time the purchasing of your investments. That way, you don't lose it all if the…
Continue reading →

August is meant to be full of gloriously hot days. An endless parade of sunshine and drinks in the park. This year it seemed mostly grey, miserable, and prone to pissing it down at a moment's notice. We all know that solar panels' efficiency wilts in the heat, but do they get a tan work standing in the English rain? At the beginning of August we installed a 4.8kWh solar battery to supplement…
Continue reading →

Much hullabaloo out of America. Apparently elite universities can no long engage in "Affirmative Action". How can they now admit a balanced and fair selection of the population? My suggestion is, as always, sortition. Let me explain. Most top flight universities around the world have the same problem. They have space for 100 students on a specific course. 15,000 apply. How do they select the…
Continue reading →

During my (brief) stint teaching senior leaders about AI, there was one question that I urged them to learn above all others. What is the acceptable failure rate? For this, I had to teach them two concepts. False Positives. For example, telling someone they have cancer when they don't. False Negatives. For example, telling someone they don't have cancer when they do. There is a cost…
Continue reading →

Truly, men have the worse of everything…⸮ But, there's something we blokes can be grateful for. No matter what grief the world throws at us, it'll always be the women's fault that there aren't enough babies! The other day, I saw this headline: The Business Insider article - in the "Economy" section - focussed solely on the lady-folk. Why do those pesky dames refuse to procreate? About hal…
Continue reading →

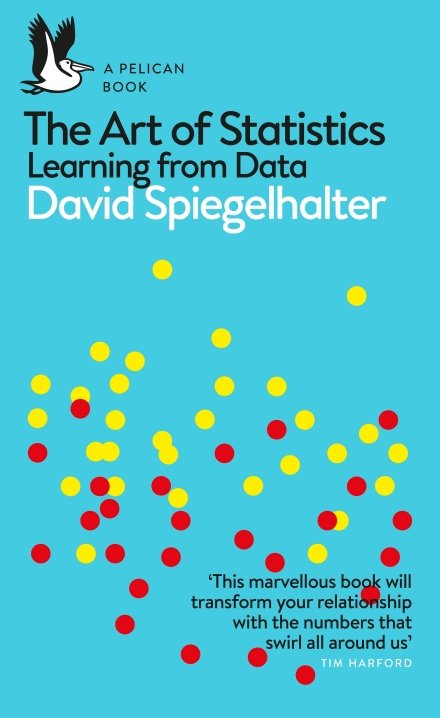
Do busier hospitals have higher survival rates? How many trees are there on the planet? Why do old men have big ears? David Spiegelhalter reveals the answers to these and many other questions - questions that can only be addressed using statistical science. Statistics has played a leading role in our scientific understanding of the world for centuries, yet we are all familiar with the way…
Continue reading →

I'm not a big fan of Virtual Reality. I find it claustrophobic and impractical for most uses. There are some areas which it does impress though. Scale. Half-a-dozen years ago - during one of VR's periodic hype-phases - an employer asked me and my team to "do something interesting" with all the expensive VR kit they'd bought on a whim. We looked at virtual store walkthroughs, simulating the…
Continue reading →

In How to Make the World Add Up, Tim Harford draws on his experience as both an economist and presenter of the BBC’s radio show ‘More or Less’ to take us deep into the world of disinformation and obfuscation, bad research and misplaced motivation to find those priceless jewels of data and analysis that make communicating with numbers so rewarding. Through vivid storytelling he reveals how we can…
Continue reading →

I've just read an interesting article by M.G. Siegler entitled - "What you’re working on sucks, just give up now, they said." It can be summed up thus: Commentators said our startup wouldn't work. Our startup did, in fact, suceed. ∴ All commentators are wrong about whether startups will work. This exhibits one of my favourite logical fallacies - survivorship bias. If you only look at the win…
Continue reading →

Surrey County Council have sent every household in the county a booklet explaining how our council tax is being spent. Within it is a highly political comment from Kevin Hurley, the newly elected Police and Crime Commissioner. He presents a pie chart showing how the police force spend its money. Take a look at it and ask yourself this question: what percentage is spent on "Employees". …
Continue reading →


