I'm doing an apprenticeship MSc in Digital Technology. In the spirit of openness, I'm blogging my research and my assignments. This is my paper from the Data Analytics module. I enjoyed it far more than the previous module. This was my second assignment, and I was amazed to score 72%. In the English system 50% is a pass, 60% is a commendation, 70% is distinction. Nice! A few disclaimers: I…
Continue reading →
10 years ago, I asked an innocent question on Twitter. Terence Eden is on Mastodon@edentIs there any service which will let me "check in" to a beer? Because this Chocolate Tom I'm drinking is amazing.❤️ 0💬 2🔁 018:55 - Thu 21 July 2011 The answers came in swiftly - Untappd was the app to use. So, a few minutes later: Terence Eden is on Mastodon@edentI just earned the 'Newbie' badge on @untappd!…
Continue reading →

I recently had cause to take a beginners course in R - a language I'm fairly familiar with. One of the other students had never used it before, so we were buddied up in order for me to show them the ropes. The first lesson of R is always the same. Read a CSV, manipulate it a bit, draw a graph. We did it all without much fuss - and a graph appeared on screen. Nifty! "I don't get it," the…
Continue reading →

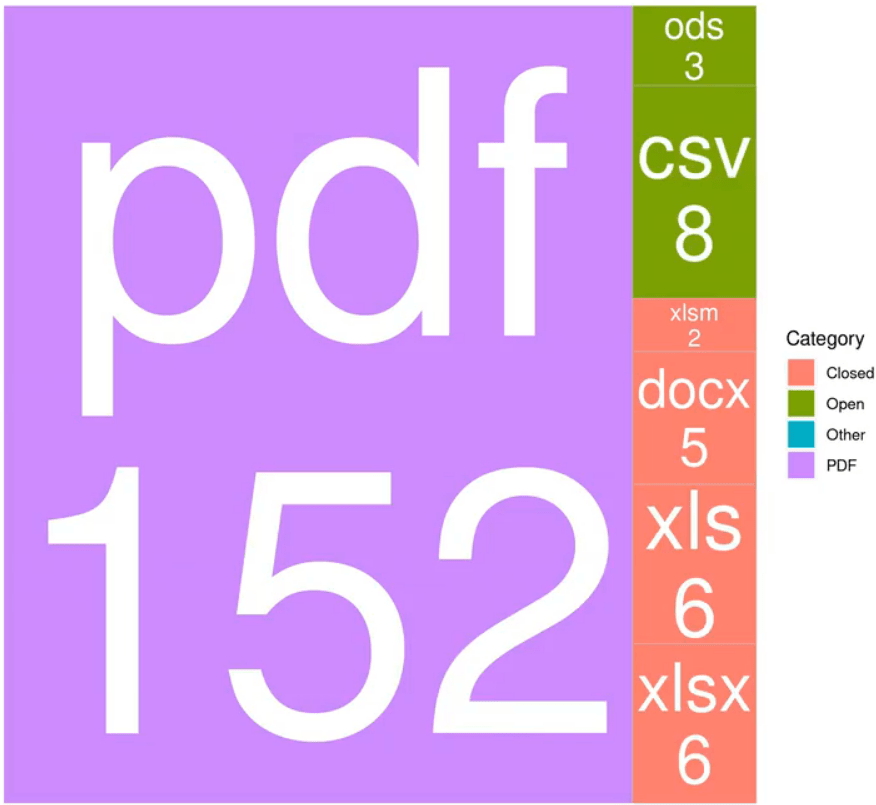
As I am a bear of very little brain, these are notes to myself on my slightly shonky process for creating animated TreeMaps in R. The aim is to end up with something like this: https://shkspr.mobi/blog/wp-content/uploads/2021/06/animated-tree-map.mp4 Generate the images Getting the data is left as an exercise for the reader (sorry!). This loops through the data and generates a separate image…
Continue reading →

As part of my MSc, I'm getting a few lessons in technologies I'm not familiar with. I've found some of these lessons extremely confusing - even when I'm proficient in the language. Here's an example of a coding fragment from one of the tutorials in the R language. Let me explain everything that I think is wrong with it. barplot(H, names.arg =M, col=“blue” xlab ='Country', ylab="Population") so…
Continue reading →