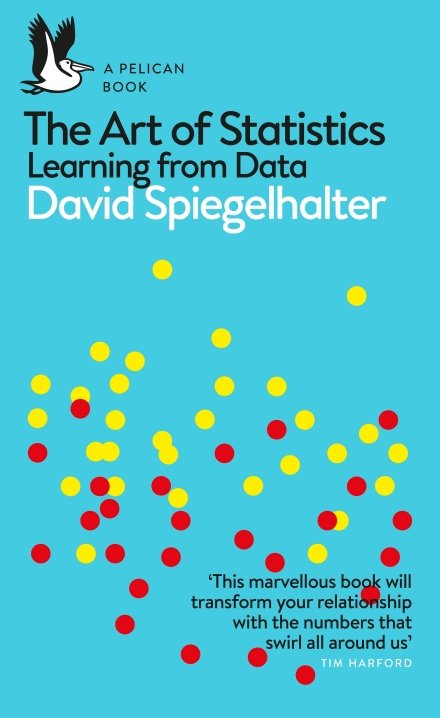
Book Review: The Art of Statistics - Learning from Data by David Spiegelhalter
By @edent![]() · Book Review statistics · 450 words · read ~113 times.
· Book Review statistics · 450 words · read ~113 times.
Do busier hospitals have higher survival rates? How many trees are there on the planet? Why do old men have big ears? David Spiegelhalter reveals the answers to these and many other questions - questions that can only be addressed using statistical science.
Statistics has played a leading role in our scientific understanding of the world for centuries, yet we are all familiar with the way statistical claims can be sensationalised, particularly in the media. In the age of big data, as data science becomes established as a discipline, a basic grasp of statistical literacy is more important than ever.
In The Art of Statistics, David Spiegelhalter guides the reader through the essential principles we need in order to derive knowledge from data. Drawing on real world problems to introduce conceptual issues, he shows us how statistics can help us determine the luckiest passenger on the Titanic, whether serial killer Harold Shipman could have been caught earlier, and if screening for ovarian cancer is beneficial.
Any book which starts with a link to a GitHub repo full of the code used to produce the statistics is bound to be good!
This is an excellent introduction and overview to why statistics are presented the way they are.
In some parts, the book is similar to the Feynmann report on the Challenger disaster. It takes a calm, dispassionate look at heartbreaking data to try to make sense of tragedy. Being able to take emotion and fear out of data is a core part of investigating the world. Something that isn't always easy to remember.
Spiegelhalter gently eviscerates journalists who have no concept of how stats work and just publish whichever big, eye-catching number they latch onto. But I found it hard not to sympathise with people who skim a poorly-constructed press release looking for the interesting headline.
The book makes brilliant use of modern ebook features - it separates footnotes and citations, it hyperlinks reference, and makes good use of crosslinking. That said, they are sometimes so dense that it's difficuly to navigate using a touchscreen.
Sadly, all the diagrams and charts are in black and white - an understandable cost saving for a print book, but a splash of colour might have livened up the ebook.
If you're involved in stats or data science then you probably won't find anything new in here - but it's a good reminder about how much work it takes to make statistics accessible for the lay reader.
| Verdict |
|---|
- Buy the eBook on Amazon Kindle
- Get the paper book from Hive
- Author's homepage
- Publisher's details
- Borrow from your local library
- ISBN: 9780241258750