I have a Tado smart thermostat - part of my smarthome project. As well as letting me set the temperature from my phone, it records environmental data, and provides a handy API for me to retrieve it.
This blog post will show you why I've gathered the data, let you download the full dataset, and explain what I learned from it.
Why do this?
There's a long-standing plan to use waste-heat from a nearby supermarket to provide communal heat to our neighbourhood.
A low temperature heat main would connect directly to the chillers at the superstore via a heat recovery unit and circulate ~25° hot water around the neighbourhood. The homes will symbiotically draw on the waste heat produced by the supermarket. A heat pump would be installed in each household, as a replacement to their existing gas boiler. The properties will use the existing radiators to run their heating longer but at a lower temperature in order to deliver the same level of thermal comfort. Bioregional's Rose Hill renewable energy feasibility study
In order to assess whether this is feasible, we need to understand heating demand.
Graph it up!
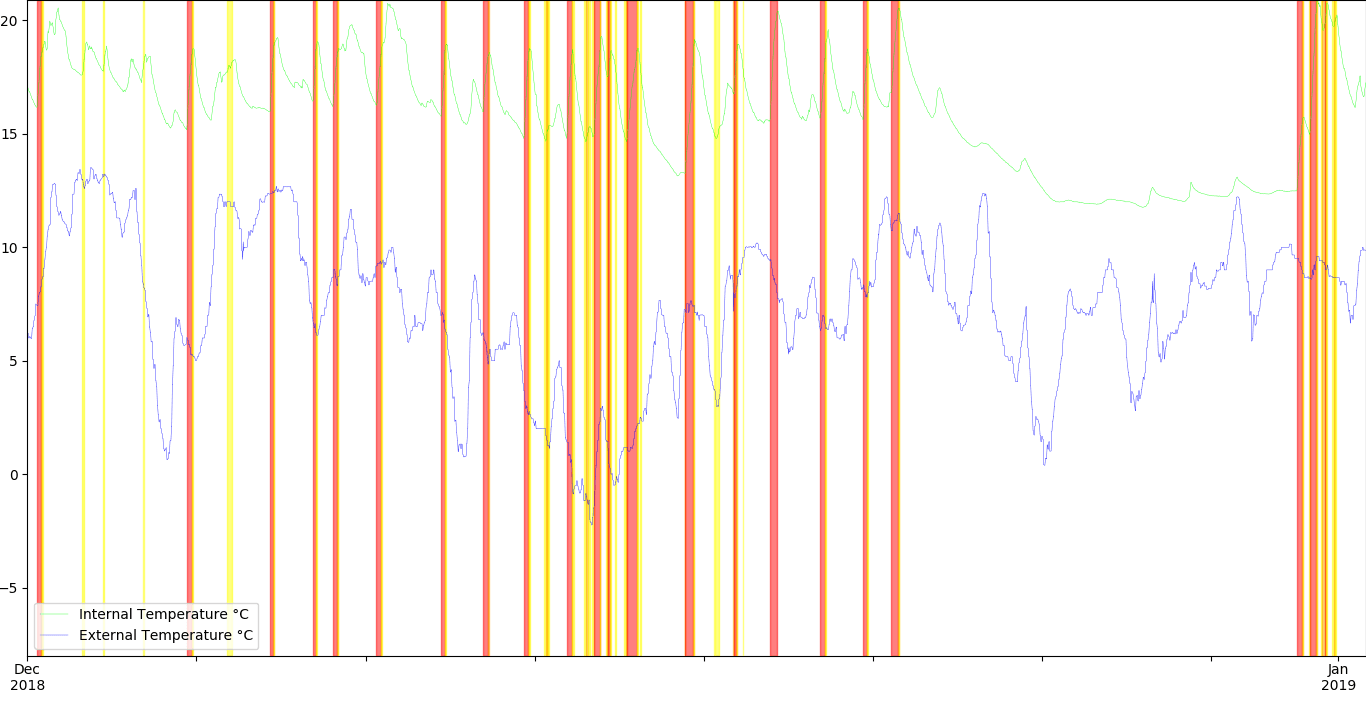
This graph shows February 14th 2017 - 2019. The green graph line is the temperature inside my house. The blue graph line is the external temperature as measured by a local weather sensor in Oxford. The vertical lines represent when the heating was on - with yellow, orange, and red representing low-demand, medium-demand, and high-demand.
- Fairly obviously, heating demand is highest in winter - but it surprised me just how late it starts.
- Internal temperature doesn't vary as much as external.
- Even in the depth of winter, with the heating off, the house didn't drop bellow 10°C. That's pretty good insulation!
Zoom!
Let's zoom in on December 2018 (tap for bigger):

We were away over the holidays, so the heating was set to stay off - unless the internal reading was under 10°C. Luckily, that didn't happen!
You can also see how rapidly the house cools when the external temperature drops.
Conversely, the rise in external temperature from 5 to 10 barely raised the internal temperature.
Enhance!
Let's zoom in on a couple of days in December 2018.
Here you can see the heating demand. The theory is that Tado can use the weather forecast to see how much heat it needs to generate. I can't easily assess whether it works in practice, but there are a few instances where the heating cuts off before the house reaches the target temperature. Presumably because it know the environment will provide the rest of the thermal energy.
Get The Data!
There are two datasets available. Both are being released under CC BY-SA 4.0.
The first is a CSV file of heating demand (190KB).

The second is the complete Tado output (2.5MB Zip, 25MB unzipped). It is a series of daily JSON files which contain:
- Internal temperature
- External temperature
- Internal humidity
- Whether anyone was at home
- What the thermostat was set to
- If the heating was on
- Heating demand
- When the hot water was on
Feel free to use this data for something interesting, or to make beautiful graphs. I make no claims to its accuracy or completeness.


2 thoughts on “Two years of home heating data”
Matt
With the aid of your API blog I gave been able to download temp data for a single date.
But I would love to know how you obtain data for multiple days. I see your attached files have multiple days, each with its own json file. Are you happy to share the code on how to pull this info down please?
Sorry to bombard but I thought this would be a good place to post my questions as well as on the API post. Thank you.
@edent
Glad it worked! I wrote a simple loop in Python to request the data for every day in the last two years.
Something like:
Good luck!