It's been a full year since we had solar panels installed on our semi-detached house in Oxford, UK.

By coincidence, the panels were switched on during the Winter Solstice - the shortest day of the year. So, how have they performed?
Tracking Solar Performance - The Easy Way
The solar panels have a generation meter. It tracks every kWh the panels produce. As of today, it stands at 4,061kWh.
 To put that into perspective, the average electricity usage per household in 2013 was 4,192 kWh - and that is dropping.
Based on our previous usage, we estimate our normal consumption to be ~3,300 kWh per year. That's about 9 kWh per day.
Without a doubt, solar panels have completely offset out energy usage and have made Oxford just a little bit greener.
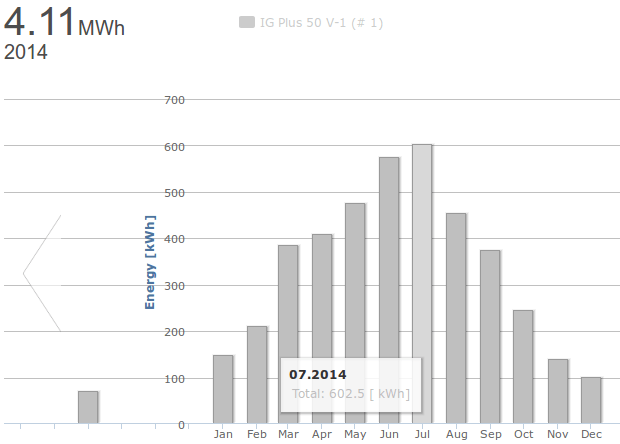
Using the Fronius Solar.Web monitoring service, we can see how the panels have performed over the year.

You can see the tail end of last December on the left. There is a slight discrepancy between what the meter records and what the API spits out.
Tracking Solar Performance - The Hacker's Way
A solar system consists of several parts. The panels, the wiring, the fuses, and the Inverter. The Inverter is a big box which changes the DC electricity from the panels into delicious AC. I specifically chose an Inverter with an API.
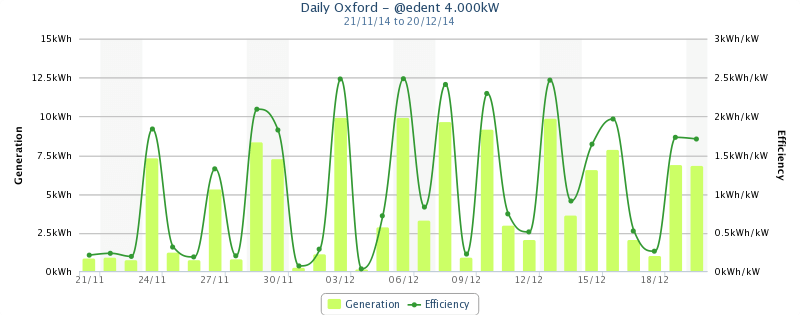
That allowed me to write a script which would graph the panels' output. What to do with that output? Why! Tweet it of course!


Once a day, at sunset, @Edent_Solar tweets a graph showing how well, or poorly, the panels have done that day. Do please feel free to follow it.
Tracking Solar Performance - The Silly Way
Ok, so that gives us daily monitoring. Isn't there a way to get a fine grained view of how the panels are performing minute-to-minute? Of course!


Yup, every minute of every day, a cheap webcam takes a photo of the sky above our house, grabs data from the solar panels, and tweets it. If you decide to follow @OxfordSolarLive, you are a muppet.
Tracking Solar Performance - Open Data
For the last few months, I've been contributing to PVoutputs - a global community of solar producers. Every 5 minutes, my panels report their generation for the world to see. This means everyone can see my solar stats by minute, hour, day, week, month, or year.
What Do We Do With The Energy?
We don't have a digital electricity meter - so it's rather hard to tell how much energy we're actually using. During the day, we've got the usual domestic appliances running - plus a couple of servers. We've got a Solar iBoost which heats our hot water with the excess electricity which we haven't been able to use. Sun heated showers are the best!
Over the last 12 months, we've diverted 962 kWh into the hot water tank.

That's roughly a quarter of what we've generated - it's cut our gas bills in summer to virtually nil. There's no API for the iBoost, sadly.
FAQs
I do have an FAQ about the panels, but I'll quickly recap.
- They cost £8,000 from the fine people at Sims Solar.
- In the last 365 days, the UK Government have paid us about £730 for our energy generation.
- It has cut our energy bills during summer to close to zero. During winter, our electricity use is also reduced. We also reduce our gas usage by heating water with an iBoost.
- The panels will pay for themselves in under 10 years. The payment scheme is in place for 20 years. The panels and associated bits are guaranteed for 10-25 years.
- No, we don't have electricity during a power-cut. That's to prevent equipment damage, or electrocuting anyone working on the power lines.
- There's no way to store the energy if we're not using it. So it flows back into the grid and is used by other houses on our street.
Want to know more? Drop a message in the comments :-)
Open Data
In the spirit of open data, I hereby give you access to about a year's worth of unfiltered data from my panels. Every minute during daylight, they've faithfully stuck the data into a .csv file. Should you wish to do something useful with it, please do so!
The format is simple. ISO 8601 date, Watts being generated, Cumulative power generation.
Enjoy!
2020 update! You can also download the full five year dataset.
These data have been cited in:
-
Colantuono,
Giuseppe
&
Kor,
Ah-Lian
&
Pattinson,
Colin
&
Gorse,
Christopher
PV with multiple storage as function of geolocation
( ) page: 217-232. Elsevier BV . Solar Energy. https://doi.org/10.1016/j.solener.2018.03.020 -
Shukhobodskiy, Alexander Alexandrovich & Colantuono, Giuseppe
RED WoLF: Combining a battery and thermal energy reservoirs as a hybrid storage system
() page: 115209. Elsevier BV. Applied Energy. https://doi.org/10.1016/j.apenergy.2020.115209 -
Lange, Jarren Hilton,
Realisation of AD hoc renewable rural power systems with decentralised active power dispatch techniques
. (2019) -
Shukhobodskiy, Alexander Alexandrovich & Zaitcev, Aleksandr & Pogarskaia, Tatiana & Colantuono, Giuseppe
RED WoLF hybrid storage system: Comparison of CO2 and price targets
() Elsevier BV. Journal of Cleaner Production. Page: 128926. DOI: https://doi.org/10.1016/j.jclepro.2021.128926 -
Wiesheu, Michael & Rutešić, Luka & Shukhobodskiy, Alexander Alexandrovich & Pogarskaia, Tatiana & Zaitcev, Aleksandr & Colantuono, Giuseppe
RED WoLF hybrid storage system: Adaptation of algorithm and analysis of performance in residential dwellings
() Elsevier BV. Renewable Energy. Page: 1036. DOI: https://doi.org/10.1016/j.renene.2021.07.032 -
Shukhobodskiy, Alexander Alexandrovich & Zaitcev, Aleksandr & Colantuono, Giuseppe
RED WoLF hybrid energy storage system: Algorithm case study and green competition between storage heaters and heat pump
() Elsevier BV. doi:10.1016/j.egyai.2023.100287


3 thoughts on “A Year Of Solar Panels - Open Data”
Stuart frame
Hi edent,
What size is your system? Is it south facing? We are going down the same route after are extension is finished but wanted a real world take on it and here it is thanks!
Do you charget your zoe at home also?
Terence Eden
Hi Stuart, It's a 4kWp system. Our roof is South-ish. Yes, I also charge my Zoe directly from them, or our solar batteries.
Wonderful. Tempting. We’re just down the M40 near Beaconsfield I always wondered how effective they were with British weather but this is way better than I anticipated.
| Reply to original comment on twitter.com
What links here from around this blog?