Lander 23 had a few pre-launch glitches, but is now up and running in Woolwich. It is a fun enough experience, but could be a whole lot more with some tweaks. In a team of four, you are split into two groups. One group operates a baffling array of switches and has to direct the other group around a ruined city because of [under developed plot point]. Only by working together can you… well, it i…
Continue reading →

Historical entities have been sighted in the old village of Lambeth. Are they ghosts? Visions? Or intruders through a crack in time? Join your guides and explore the backwaters and byways that slowly spread over the mysterious marshes of Lambeth. Most walking tours have a guide drag you around the well-known tourist hot-spots while they read out a bit from Wikipedia. Minimum Labyrinth’s tour i…
Continue reading →

My mate Greg, without meaning to, makes all other husbands look bad. It's not enough that he is a loving partner, devoted father, and pillar of the community. Oh no. He also has to go and make the most amazing reservations for wedding anniversaries. My wife, Liz, and I were running slightly late for our meeting with Greg and his delightful wife Jamie. We hadn't seen them for... oooh... About a…
Continue reading →

It's always slightly weird when entertainment transfers from one medium to another. The actors on stage never look like the characters you imagined when you read the book. A prog-rock concept album loses its grandeur when transferred to 27 part Netflix series. And the subversive intent of the comic book is neutered to make a blockbuster movie. So what happens when a hit radio show is transformed …
Continue reading →

Into the woods, it's time to go, I hate to leave, I have to go. Into the woods, it's time, and so I must begin my journey. I live near the ancient Abbey Woods. Site of the derelict Lesnes Abbey, full of flowers, trees, and eternal mysteries. A tattered parchment map fluttered into my hand promising adventure and enlightenment deep in the heart of the woods. This is Lore of the Wild an…
Continue reading →

Spotted in London, yesterday. A large, Microsoft Windows-powered advertising hoarding has been hijacked. It's not uncommon to see broken-down Windows displays - I run https://windowsisbroken.tumblr.com/ - which is dedicated to pointing and laughing at such mistakes. But this is the first time I've seen a display repurposed for profit! It appears to be running NiceHash Miner Legacy. A…
Continue reading →

Earlier this year, I won the BlueLightCamp Hackathon. Usually prizes are a token of appreciation - vouchers, a books, maybe even a new phone if you're lucky. This, however, was a "money can't buy" prize - a trip through the Thames Barrier. And so, during one of London's delightfully wet summer's days, I made my way to the site in Greenwich. Here are some of the photos I took during the trip. …
Continue reading →

As I was wandering over Waterloo Bridge, I spotted a Blimp flying above London. I find that Blimps have an otherworldly quality. Sleek, silent, and majestic. I fired off a few photos as it flew overhead. It then turned and went to approach The Shard. Where, finally, it docked and her passengers alighted. Here's the time lapse: Of course, it was just a trick of perspective. But wouldn't it …
Continue reading →

A delightful evening in London spent watching a pair of helicopters fly through Tower Bridge. It appears that it's part of the London™ 2012© Olympics® opening ceremony. First, the practice run: Then the three flights through the bridge Thanks to IanVisits for alerting us to the event, and Tom Scott for organising the picnic. …
Continue reading →

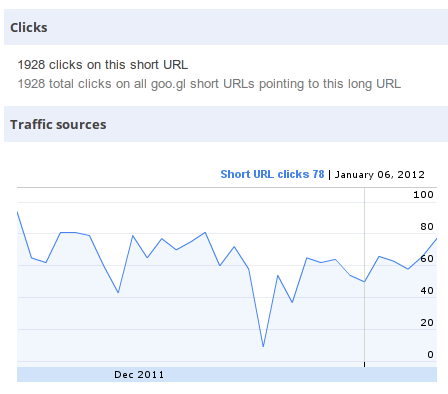
At the start of 2012, I revealed how many scans TfL's QR campaign was getting. A lot of comments on Twitter & Google+ dismissed these results as a success. A typical response was: 70 scans a day? In a city of millions? Rubbish! This fails to address something that advertisers are conspicuously loathe to reveal - the true "response rate" of any advert is hard to calculate. How many phone…
Continue reading →

Wandering through London today, I noticed that Southbank London has put QR codes on its posters. I've mentioned before the dangers of using Bit.ly as a QR code generator - as it allows us to peek at the codes' performance statistics. Here are the codes on the posters - click for bigger. As all the codes use Bit.ly so we can see how well they've performed - click on each one for the latest…
Continue reading →
Last year, I suggested that TfL should use QR codes to point to their excellent mobile countdown service. Looks like someone was listening! I spotted this poster at a tube station. Nestled in the corner is a QR code pointing at the mobile bus countdown service! This is a close-to-perfect use of QR. Points to a mobile site. Easy to scan code. Good call to action. As I…
Continue reading →